Set up OpenTelemetry with Inngest TypeScript only
OpenTelemetry lets Inngest connect what happens inside a function run to the libraries, model calls, services, and databases your code uses.
Inngest uses OpenTelemetry for two separate features:
- AI metadata extraction: Extract AI metadata from OpenTelemetry spans with OpenTelemetry GenAI attributes and attach it to the step where the model call happened. This is enabled by default with
aiMetadata: true. - Extended Traces: Export spans from inside your function run into Inngest Traces, so database queries, HTTP calls, AI requests, and custom spans appear in the run timeline.
This guide first shows how to set up OpenTelemetry in your process. After that, it shows how to use that setup for AI metadata extraction and Extended Traces.
Set up OpenTelemetry
Use @inngest/otel if you want Inngest to set up the Node.js OpenTelemetry provider and common instrumentation for you. Bring your own OpenTelemetry setup if your app already owns its provider, exporters, resources, sampling, or instrumentation list.
Automatic setup with @inngest/otel
If your application does not already configure OpenTelemetry, install and use @inngest/otel to set up a Node.js provider and common instrumentations.
Preload it before your application:
node --import @inngest/otel/node ./app.js
If --import is not available, use a small bootstrap file as your process entrypoint. Because ESM static imports are evaluated before the importing module runs, keep the dynamic await import("./app.js"); a static import "./app.js" in the same file can load app modules before instrumentation is registered.
import "@inngest/otel/node";

await import("./app.js");
Manual setup with your existing provider
If your application already uses OpenTelemetry, keep your existing provider, exporters, resources, sampling, and instrumentations. The important part is loading instrumentation before application code imports packages you want OpenTelemetry to patch.
Manual setup has three parts:
- Create and register your OpenTelemetry provider.
- Register the instrumentations your app needs.
- Preload instrumentation before importing app code or packages you want OpenTelemetry to patch.
CommonJS applications
For CommonJS apps, create instrumentation.cjs and start Node with --require:
node --require ./instrumentation.cjs ./app.cjs
const {
  getNodeAutoInstrumentations,
} = require("@opentelemetry/auto-instrumentations-node");
const { registerInstrumentations } = require("@opentelemetry/instrumentation");
const { OTLPTraceExporter } = require("@opentelemetry/exporter-trace-otlp-http");
const { BatchSpanProcessor } = require("@opentelemetry/sdk-trace-base");
const { NodeTracerProvider } = require("@opentelemetry/sdk-trace-node");

const provider = new NodeTracerProvider({
  spanProcessors: [
    // Keep your existing exporter and span processors.
    new BatchSpanProcessor(new OTLPTraceExporter()),
  ],
});

provider.register();

registerInstrumentations({
  instrumentations: [
    ...getNodeAutoInstrumentations(),
    // Add any extra AI, database, queue, or framework instrumentations here.
  ],
  tracerProvider: provider,
});
ESM applications
For ESM apps, create instrumentation.mjs and start Node with --import:
node --import ./instrumentation.mjs ./app.mjs
import { register } from "node:module";

register("@opentelemetry/instrumentation/hook.mjs", import.meta.url);

const [
  { getNodeAutoInstrumentations },
  { registerInstrumentations },
  { OTLPTraceExporter },
  { BatchSpanProcessor },
  { NodeTracerProvider },
] = await Promise.all([
  import("@opentelemetry/auto-instrumentations-node"),
  import("@opentelemetry/instrumentation"),
  import("@opentelemetry/exporter-trace-otlp-http"),
  import("@opentelemetry/sdk-trace-base"),
  import("@opentelemetry/sdk-trace-node"),
]);

const provider = new NodeTracerProvider({
  spanProcessors: [
    // Keep your existing exporter and span processors.
    new BatchSpanProcessor(new OTLPTraceExporter()),
  ],
});

provider.register();

registerInstrumentations({
  instrumentations: [
    ...getNodeAutoInstrumentations(),
    // Add any extra AI, database, queue, or framework instrumentations here.
  ],
  tracerProvider: provider,
});
ESM instrumentation is sensitive to package version topology, leading to silently lost spans. This is typically caused by a single OpenTelemetry package being installed multiple times. The following section will explain the problem and provide a solution.
The loader registered by @opentelemetry/instrumentation/hook.mjs only sees patches registered through the same installed @opentelemetry/instrumentation and import-in-the-middle dependency tree. If OpenAI, Anthropic, Google, database, or other instrumentation packages resolve to different copies, spans may be missed without an obvious startup error.
Install the instrumentation packages you need, then check which versions were installed:
npm ls @opentelemetry/instrumentation \
  | awk -F'@opentelemetry/instrumentation@' 'NF > 1 { split($2, parts, " "); print parts[1] }' \
  | sort -u
pnpm list @opentelemetry/instrumentation --depth Infinity \
  | awk '/@opentelemetry\/instrumentation / { print $NF }' \
  | sort -u
You should see a single version. Add @opentelemetry/instrumentation to your package.json at that version so instrumentation.mjs resolves the same package that your instrumentation list uses.
If you see multiple versions, your instrumentation packages depend on incompatible OpenTelemetry instrumentation versions. Prefer upgrading or downgrading those instrumentation packages until they share one compatible version. Package-manager overrides can force a version, but only use them after confirming the packages support that OpenTelemetry range.
Use OpenTelemetry with Inngest
After OpenTelemetry is loaded, you can use it for AI metadata extraction, Extended Traces, or both.
Extract AI metadata from OpenTelemetry spans
AI metadata extraction parses OpenTelemetry span attributes into Inngest step metadata. Metadata is attached to the step and appears as inngest.ai metadata in the run details.
No Extended Traces middleware is required for AI metadata extraction. To opt out, set aiMetadata: false on the Inngest client:
import { Inngest } from "inngest";

export const inngest = new Inngest({
  id: "my-app",
  aiMetadata: false,
});
See the aiMetadata client option and metadata reference for details.
Enable Extended Traces
Extended Traces export application OpenTelemetry spans from inside an Inngest function run to Inngest Traces. Use this when you want HTTP calls, database queries, AI requests, and custom spans to appear in the run timeline.
If you create the provider yourself, add new InngestSpanProcessor(inngest) to that provider and configure the Inngest middleware with behaviour: "off".
The provider setup imports your Inngest client, so keep that module focused on creating the client. Do not use it as a barrel file that imports your app entrypoint, functions, route handlers, database clients, or AI SDK clients. Those modules should import the Inngest client, not the other way around.
import { Inngest } from "inngest";
import { extendedTracesMiddleware } from "inngest/experimental";

export const inngest = new Inngest({
  id: "my-app",
  middleware: [extendedTracesMiddleware({ behaviour: "off" })],
});
Add the span processor when you create your provider. In an ESM preload, import these modules dynamically after registering the OpenTelemetry hook, following the instrumentation.mjs pattern above.
import { OTLPTraceExporter } from "@opentelemetry/exporter-trace-otlp-http";
import { BatchSpanProcessor } from "@opentelemetry/sdk-trace-base";
import { NodeTracerProvider } from "@opentelemetry/sdk-trace-node";
import { InngestSpanProcessor } from "inngest/experimental";
import { inngest } from "./inngest/client";

const provider = new NodeTracerProvider({
  spanProcessors: [
    new BatchSpanProcessor(new OTLPTraceExporter()),
    new InngestSpanProcessor(inngest),
  ],
});
Which Extended Traces behaviour mode should I use?
If you create the OpenTelemetry provider yourself and add InngestSpanProcessor, set behaviour to "off".
If you want the middleware to attach to an already-registered provider, set behaviour to "extendProvider".
Avoid behaviour: "createProvider" for new setups. Provider creation from the middleware is deprecated.
Create custom spans with Extended Traces
Once Inngest Extended Traces is properly set up in your application, your Inngest workflow will receive an additional tracer argument:
import { inngest } from './client'

export const userOnboarding = inngest.createFunction(
  { id: "user-onboarding", triggers: { event: "user.onboarding" } },
  async ({ event, step, tracer }) => {
    //  ...
  }
);
The tracer object is an @opentelemetry/api's Tracer instance enabling you to create custom traces as follows:
import { inngest } from './client'
import { sendEmail } from './emails'

export const userOnboarding = inngest.createFunction(
  { id: "user-onboarding", triggers: { event: "user.onboarding" } },
  async ({ event, step, tracer }) => {
    await step.run("create-user", async () => {
      // ...
    });

    await step.run("send-welcome-email", async () => {
      await tracer.startActiveSpan("call-email-service", async (span) => {
        const { name, email } = event.data;

        try {
          span.setAttributes({ name, email });

          await sendEmail({ name, email });
        } catch (error) {
          span.recordException(
            error instanceof Error ? error : new Error(String(error))
          );
          throw error;
        } finally {
          span.end();
        }
      });
    });
  }
);
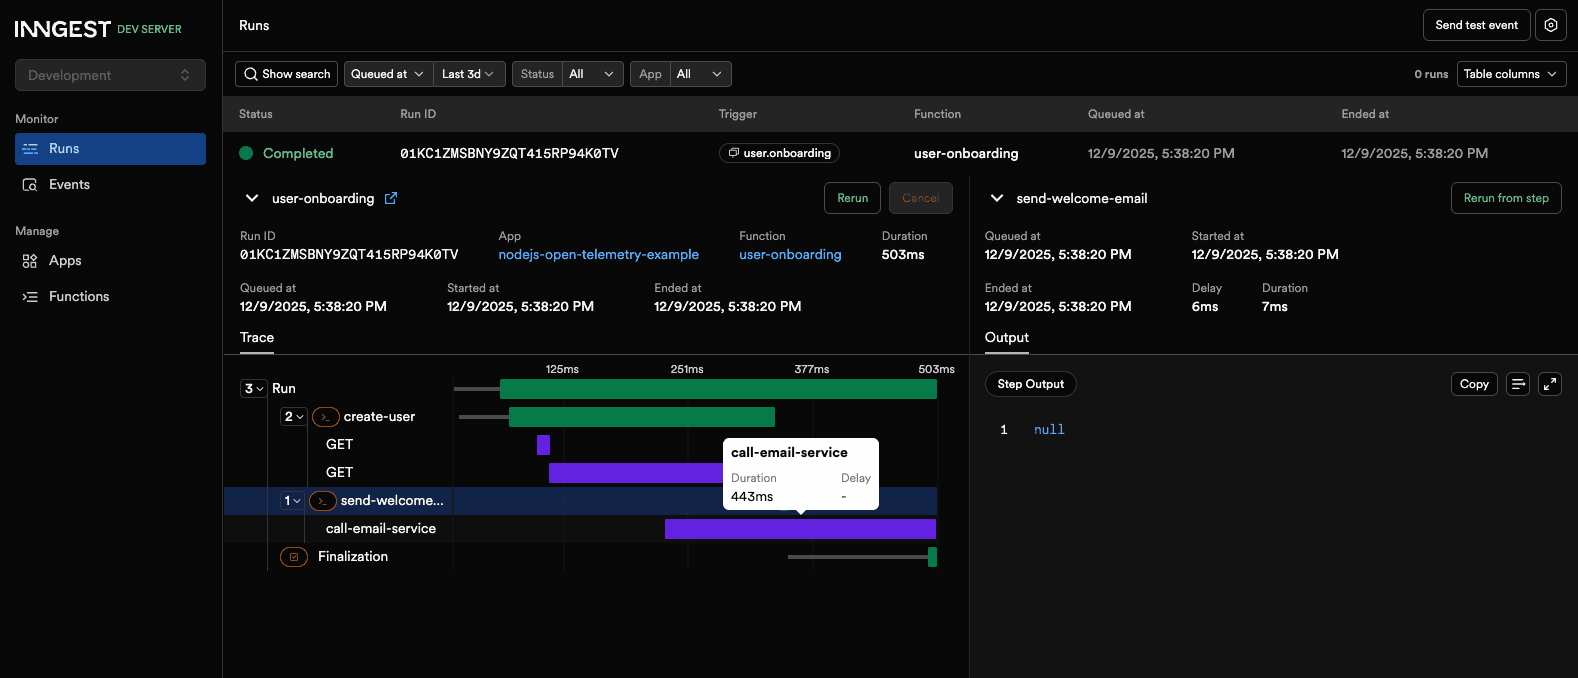
Using tracer.startActiveSpan(), we create a custom call-email-service span to track the performance of the external sendEmail() service.
Our custom span is properly displayed within our Inngest workflow run Traces: